*Special* - Behind-The-Scenes Look: Insights and Industry Trends Now and For the Future
As a SaaS company who openly invites feedback from our users, we’re often asked about how we decide what new features to add to the Diversys platform, and when.
This week’s special blog post shares important insights about the direction the waste and recycling industry is moving in and what is needed for organizations to stay competitive. We peel back the curtain to reveal how Diversys decides the features that our users need the most right now – and how those features help them achieve their goals now and in the future.

It’s an understandable question, given the changing nature of and priorities in the waste and recycling industry. We want to make sure our users are always fully supported, no matter what their requirements or performance goals are, but with so much diversity in our userbase – across different jurisdictions, types of organizations, and (legislative) requirements –
how do we figure out what features everyone needs now in order to stay competitive?
And how do we make sure we keep all our users future-proofed as their requirements change?
With the launch of the latest version of Diversys earlier this month, we’ve added a bunch of new features to do just that. So, we thought it would be a great time to pull back the curtain a bit and unpack the story behind two of those new features: data visualization and greenhouse gas (GHG) emission reduction tracking.
Why did we decide to add these features now? And why do they matter? How are they helping our customers, and the industry as a whole, move towards a world without waste?
Read on to learn more about the important role these features play in the waste and recycling space – and how your organization can benefit.
The Dilemma
If you haven’t had to do it yourself, take our word for it: calculating how much GHG emission reduction your program has achieved (by month, quarter, or year) is complicated.
And if your materials go to different destinations (e.g., landfills, recycling plants, composting facilities, etc.), it only adds layers of complication.
Whether they were mandated to track GHG reduction or voluntarily chose to do so, many of our customers were struggling to do these calculations. And with multiple recycling products, destinations, and jurisdictional requirements, the calculations only got harder to perform.
At the same time, GHG tracking is becoming more important than ever: with growing environmental awareness, many more organizations are realizing the benefits of tracking their GHG emissions or the reduction they’ve managed to achieve. Others are being mandated to share this information with legislative bodies or other stakeholders – it’s become a key metric from ethical and ESG investors especially. These investors often ask how much GHG reduction is being achieved, and they only want to invest in organizations that are meeting their goals.

As a result, Diversys’ mandate was clear: bring simplicity to this overly complex calculation. Could we find a way to track GHG emission reduction as various waste and recycling activities were being performed – so no unnecessary steps and calculations needed to be made?
The answer was yes.
More on how we did that later.
But the complexity our customers face also brought to our attention another problem.
More organizations than ever need to report – both internally and externally – on what they’re doing. Whether it’s to legislative bodies, the public, or internal stakeholders, waste and recycling organizations have more eyes on them than ever before, and there are more people with a vested interest in how their programs are performing.
But, with complex programs, requirements, and goals, it can be difficult for organizations to share their progress in a meaningful story that others can easily understand.
After all, what does it matter to the public if an organization were to say, “we recycled 10,000 aluminum cans last year”? 10,000 out of how many? How can they have the context to understand that amount?
And internally, how could our customers easily share with their teams or partners how they’re improving operations? Are they getting better each month, quarter, or year?
So, the question we asked ourselves was: How could we help our customers easily capture this information and share it – not just as numbers on a spreadsheet, but in a meaningful story?
The Solution
It was clear that our customers – and the industry as a whole – needed a solution to the twin problems of complexity in GHG emission reduction tracking and sharing their stories in a meaningful way.
To address this, we added two new capabilities to the Diversys platform: now, in addition to all the other program- and data management tools Diversys offers, users can also track GHG emission reduction and use improved data visualization to see progress and track performance.
GHG Emission Reduction Tracking
As mentioned, customers needed to perform difficult GHG emissions (and reduction) calculations quickly and accurately.
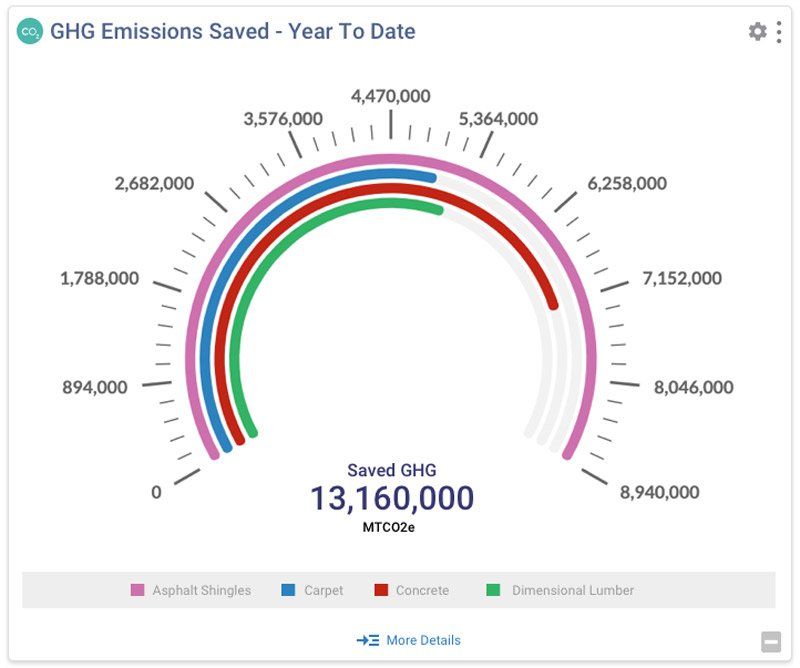
We added this capability so users could see exactly how much GHG emission reduction they’ve achieved, based on the specifics of what’s happening to their products (I.e. if they’re being landfilled, composted, or recycled).
Best of all, this tracking happens as users are inputting data and as it’s being compiled. You don’t have to manually calculate these figures at the end of your reporting period – you can see these numbers at any time.
Improved Data Visualization
Customers needed to be able to see how their programs are performing at any time, be confident in the accuracy of the info, and be able to share it with others, with just a few clicks.
We wanted to give our users the ability to easily see and share this information. Numbers in an Excel spreadsheet simply don’t tell a compelling story.
We’ve enhanced the software’s ability to provide graphs, charts, and other visual tools to share key metrics – not only for sharing but also for internal monitoring and performance tracking.

With unparalleled data management and visualization capabilities, monitoring and reporting on progress and results have never been easier, faster, or more accurate. Users can now see an instant picture of live results via dashboards customized to their organization’s unique requirements. Reports can be generated with just a few clicks, enabling results and progress to be seen and shared as required, all using the very latest data.
Now it’s easy to compare performance in one time period to another, see the progress towards your goals, and share meaningful reports with external parties.
One new widget we’ve added is a perfect example of a compelling metric: the total volume/weights collected widget.
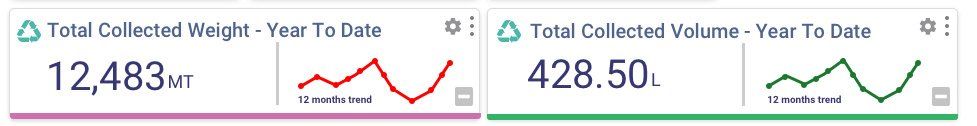
Organizations are using this widget to share an easy-to-understand figure with stakeholders, investors, higher ups, or even the public. It’s a quick and easy way to help internal and external parties understand how much your program has achieved.
What This Means for Our Customers
Both of these new features – GHG reduction tracking and enhanced data visualization - are crucial for our customers. They transform the way they measure and report on their progress; these new capabilities are truly game changers.
They’re important because they save time, and in our increasingly complex world, that’s imperative. The organizations we work with have responsibilities and complexities that are only increasing. By having automatic, accurate calculations and the ability to visually see progress towards goals, our users can focus on the things that really matter – like making decisions for the business – and not get caught up in day-to-day minutia.
At the same time, they don't need to recreate their data for internal reports or external presentations – it's all ready to use. In fact, all the data that our users get from Diversys is in real time – meaning they can see it right away, respond to what they’re seeing and make tactical and strategic decisions. That is a huge advantage.
Data visualization enhances the software’s existing dashboard, which already gives users the ability to track monthly and annual targets and get more data on how and why you are or are not hitting those targets.
These features give our customers the ability to stay competitive, perform better, be more productive, and communicate more effectively with stakeholders.
In addition to these two, Diversys offers a host of tools to our customers to manage their program best.
Get in touch with a program management specialist today to learn more and find out how you can benefit.
About Diversys
Diversys is proud to have its roots in Ontario, Canada - a province widely recognized for its leadership in EPR and sustainability. Since 2019, we've been dedicated to creating innovative software solutions that drive progress toward a world without waste.
Our story is a testament to the power of hard work, customer loyalty, and big ideas. We are committed to empowering organizations with the waste recycling software solutions necessary for achieving a sustainable future. Our cutting-edge software platform is helping organizations achieve their ESG goals, meet reporting obligations, and improve operational efficiency for their recycling programs.
Our commitment to delivering world-class solutions that drive meaningful progress towards waste reduction and a more sustainable future is unwavering. Our team of industry experts is ready to help you navigate the rapidly-evolving waste management landscape as we progress toward a circular economy.